library(tidyverse)
library(haven)
library(hrbrthemes)
library(survey)
library(srvyr)
library(labelled)
library(sjmisc)
library(sjPlot)
library(gmodels)
library(gtsummary)
library(skimr)
library(ggblanket)Appendix D — Skill Assignment 3: EDA 1 & data management
D.1 Overall Discussion
This dataset will provide me with a range of potential variables to investigate attitudes about overturning Roe v. Wade. Among them are voting in the 2020 presidential election, political party identification, ideology, where people live, gender, religiosity, and whether people follow the news.
Based on the graphs:
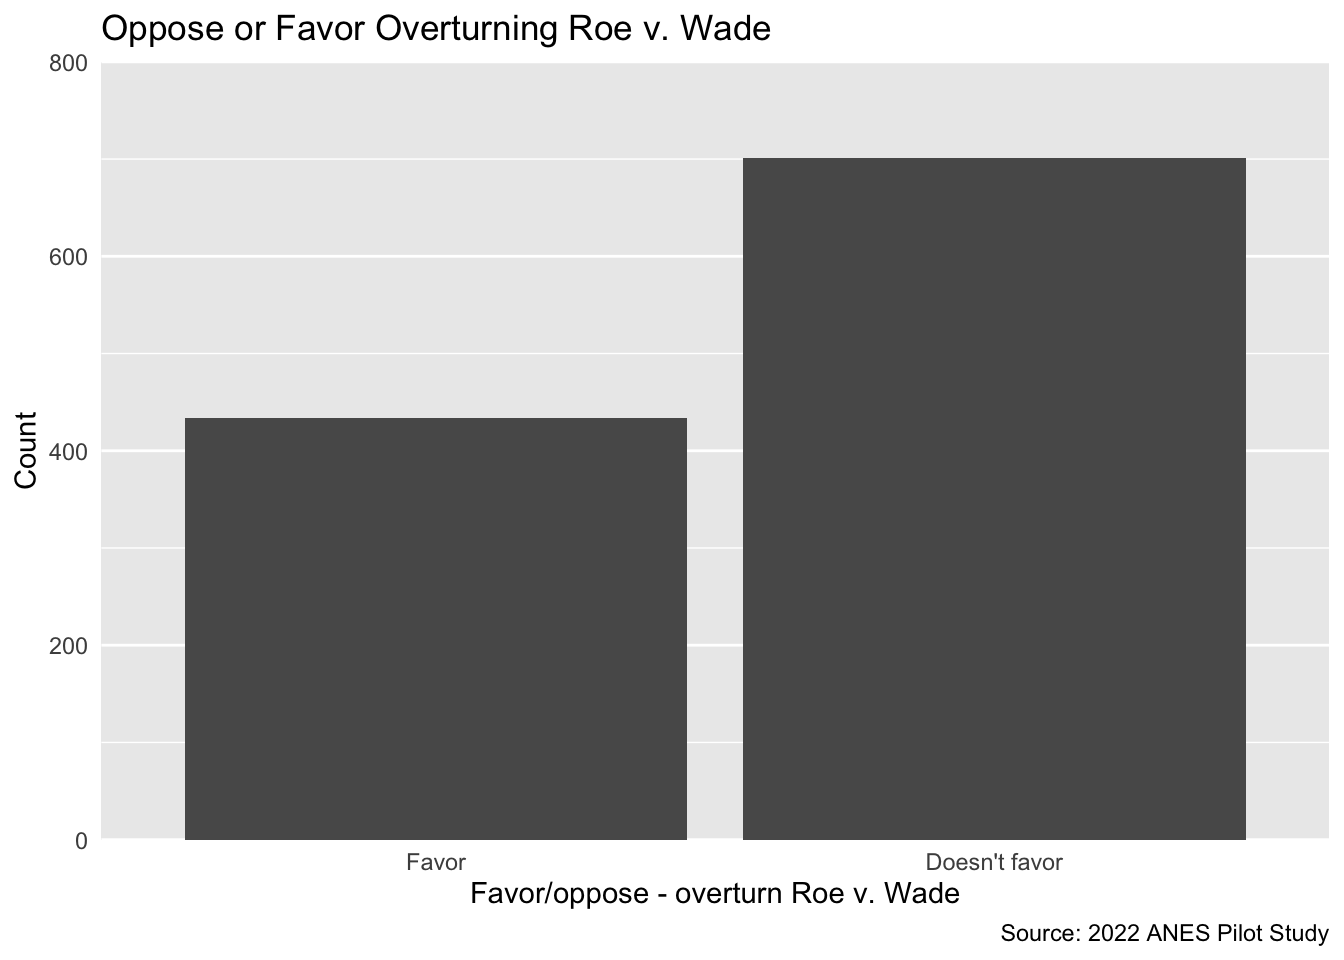
fewer people favor overturning Roe.
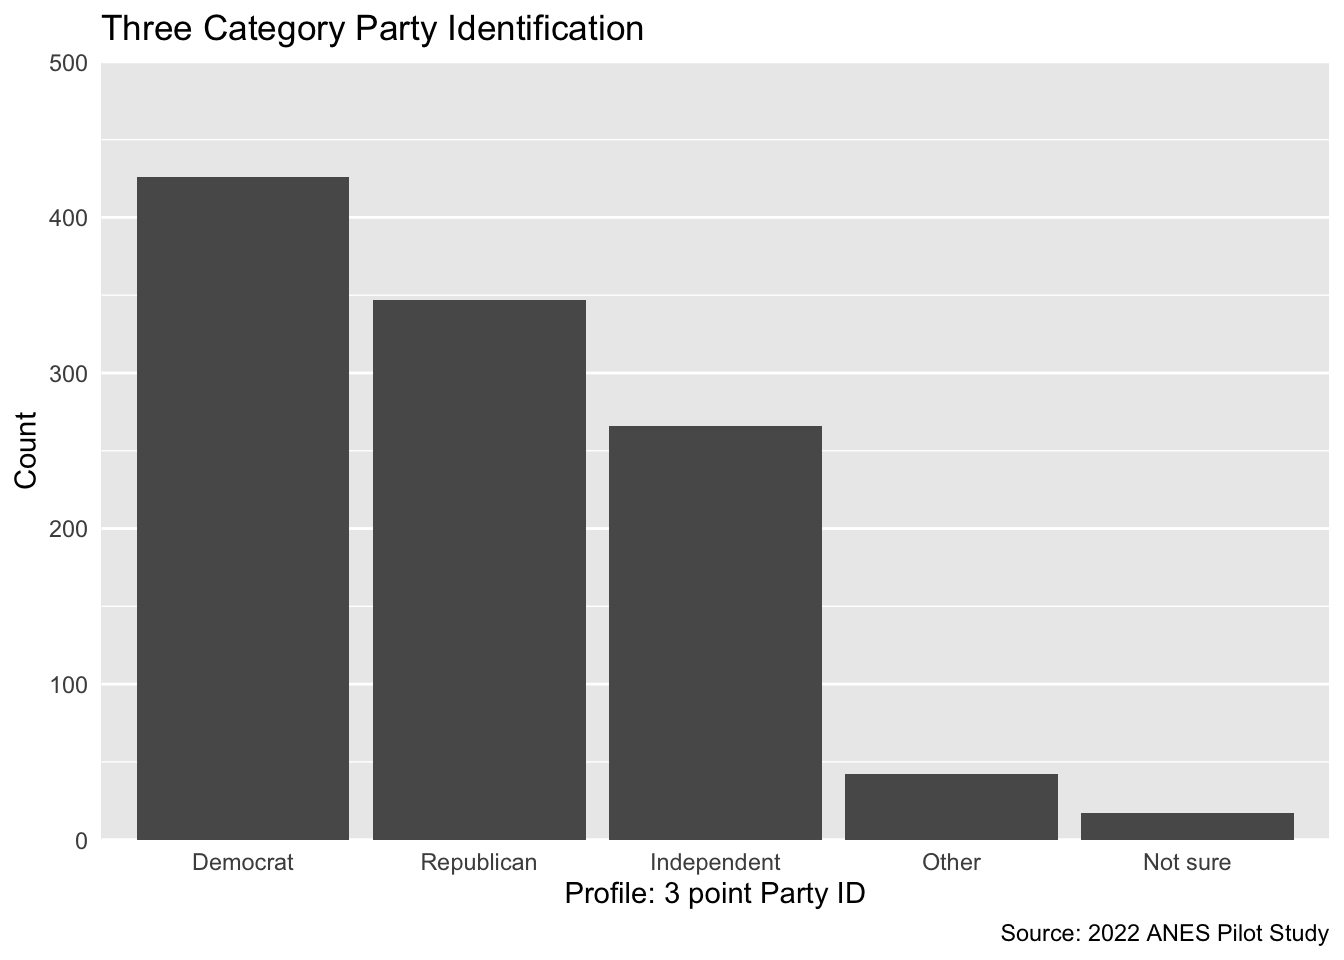
There are more Democrats than Republicans. (Note to self: If I want to use this variable I should filter out “other” and “not sure.)
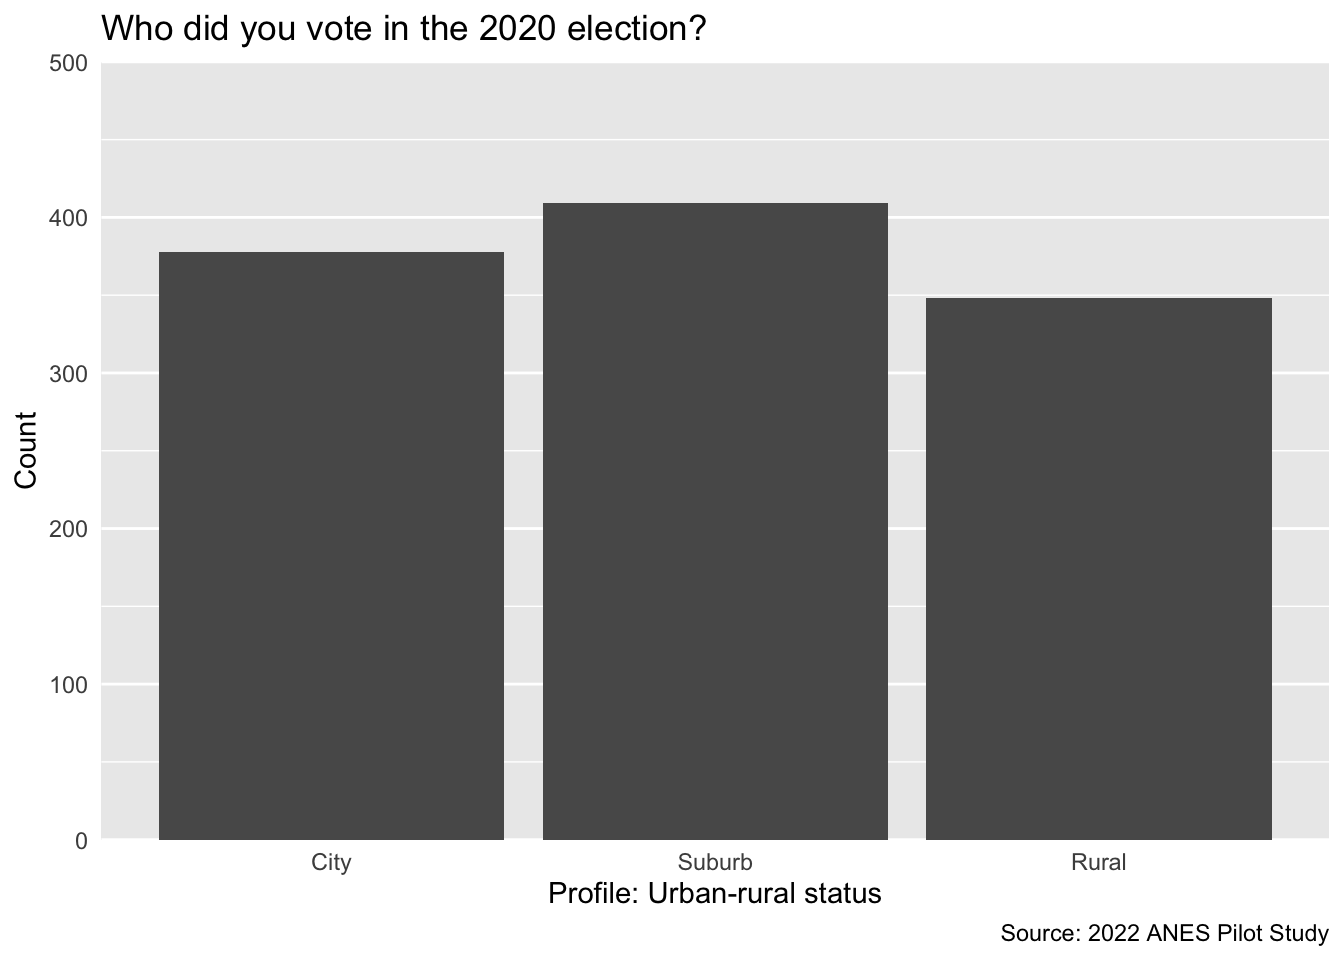
Suburbanites are the biggest group, but there is a balance between city, suburb, and rural Americans in the survey.
You can talk about other variables in your codebook too!
D.1.1 Load Packages
D.1.2 Load Your Dataset
Need help? Go to chapter x in the webbook.
load("anes_pilot.RData")D.2 Discussion of data management
Select: I added a variable that tells us who the respondent voted for in the 2020 presidential election from the original dataset,
presvote20post.Filter the variable
presvote20postso the dataset now only includes people who voted for either Trump or Biden.Recode Roe so that there are two categories: favor and don’t favor.
Recode urbanicity2 so that there are 3 categories: city, suburban, and rural.
Need help? Go to chapter x in the webbook.
# Select variables

anes_pilot_variables <- anes_pilot |>
  select(roe, presvote20post, urbanicity2, pid3, ideo5, gender, pew_religimp, follow, caseid, weight)

anes_pilot_variables <- anes_pilot_variables |>
  filter(presvote20post < 3)

anes_pilot_variables <- anes_pilot_variables |>
  as_factor() |>
  mutate(roe_recode = fct_collapse(roe,
                                   "Favor" = c("Favor"),
                                   "Doesn't favor" = c("Oppose", "Neither favor nor oppose")))

anes_pilot_variables <- anes_pilot_variables |>
  as_factor() |>
  mutate(urbanicity2_recode = fct_collapse(urbanicity2,
                                   "City" = c("Big city", "Smaller city"),
                                   "Suburb" = c("Suburban area"),
                                   "Rural" = c("Small town", "Rural area")))
D.2.1 Graph 1
Need help? Go to chapter 4 in the webbook.
anes_pilot_variables |>
   as_factor() |>
   drop_na(roe_recode) |>
  gg_bar(
  x = roe_recode,
    title = "Oppose or Favor Overturning Roe v. Wade",
  x_title = "Oppose or Favor Overturning Roe v. Wade",
  y_title = "Number of Respondents",
  caption = "Source: 2022 ANES Pilot Study"
)
D.2.2 Graph 2
Need help? Go to chapter 4 in the webbook.
 anes_pilot_variables |>
   as_factor() |>
   drop_na(pid3) |>
    gg_bar(
      x = pid3,
      title = "Three Category Party Identification",
  x_title = "Three Category Party Identification",
  y_title = "Number of Respondents",
  caption = "Source: 2022 ANES Pilot Study"
)
D.2.3 Graph 3 (add more if you want to!)
Need help? Go to chapter 4 in the webbook.
 anes_pilot_variables |>
   as_factor() |>
   drop_na(urbanicity2_recode) |>
      gg_bar(
      x = urbanicity2_recode,
      title = "Who did you vote in the 2020 election?",
  x_title = "Who did you vote for? (vote20)",
  y_title = "Number of Respondents",
  caption = "Source: 2022 ANES Pilot Study"
)
D.2.4 Run Univariate Statistics
Need help? Go to chapter 4 in the webbook.
anes_pilot_variables |>
  as_factor() |>
  tbl_summary()

anes_pilot_variables |>
  as_factor() |>
  skim() |>
yank("numeric")| Characteristic | N = 1,1351 |
|---|---|
| Favor/oppose - overturn Roe v. Wade | |
| Favor | 434 (38%) |
| Oppose | 554 (49%) |
| Neither favor nor oppose | 147 (13%) |
| Profile: 2020 President Vote Post Election | |
| Joe Biden | 607 (53%) |
| Donald Trump | 528 (47%) |
| Jo Jorgensen | 0 (0%) |
| Howie Hawkins | 0 (0%) |
| Other | 0 (0%) |
| Did not vote for President | 0 (0%) |
| Profile: Urban-rural status | |
| Big city | 213 (19%) |
| Smaller city | 165 (15%) |
| Suburban area | 409 (36%) |
| Small town | 151 (13%) |
| Rural area | 197 (17%) |
| Profile: 3 point Party ID | |
| Democrat | 426 (39%) |
| Republican | 347 (32%) |
| Independent | 266 (24%) |
| Other | 42 (3.8%) |
| Not sure | 17 (1.5%) |
| Unknown | 37 |
| Profile: Ideology | |
| Very liberal | 144 (13%) |
| Liberal | 195 (17%) |
| Moderate | 328 (29%) |
| Conservative | 271 (24%) |
| Very conservative | 168 (15%) |
| Not sure | 28 (2.5%) |
| Unknown | 1 |
| Profile: Gender | |
| Male | 519 (46%) |
| Female | 616 (54%) |
| Profile: Importance of religion (Pew version) | |
| Very important | 450 (40%) |
| Somewhat important | 283 (25%) |
| Not too important | 154 (14%) |
| Not at all important | 248 (22%) |
| Follow what’s going on in government and public affairs | |
| Most of the time | 675 (59%) |
| Some of the time | 307 (27%) |
| Only now and then | 116 (10%) |
| Hardly at all | 37 (3.3%) |
| Case ID | 674 (330, 1,060) |
| Analysis weight | 0.84 (0.64, 1.13) |
| Unknown | 78 |
| Favor/oppose - overturn Roe v. Wade | |
| Favor | 434 (38%) |
| Doesn't favor | 701 (62%) |
| Profile: Urban-rural status | |
| City | 378 (33%) |
| Suburb | 409 (36%) |
| Rural | 348 (31%) |
| 1 n (%); Median (Q1, Q3) | |
Variable type: numeric
| skim_variable | n_missing | complete_rate | mean | sd | p0 | p25 | p50 | p75 | p100 | hist |
|---|---|---|---|---|---|---|---|---|---|---|
| caseid | 0 | 1.00 | 709.38 | 440.25 | 1.0 | 330.50 | 674.00 | 1059.50 | 1585.00 | ▇▇▆▆▅ |
| weight | 78 | 0.93 | 0.94 | 0.43 | 0.3 | 0.64 | 0.84 | 1.13 | 4.33 | ▇▂▁▁▁ |
D.2.5 Save your updated dataset?
Need help? Go to chapter 4 in the webbook.
save(anes_pilot_variables, file = "anes_pilot_variables.RData")