2 Navigating RStudio
2.1 The RStudio Layout
The first time you open an assignment in RStudio Cloud, the console window will take up the entire left side. You will see three panes.
Once you open a script file, you will see the four-quadrant layout seen below.
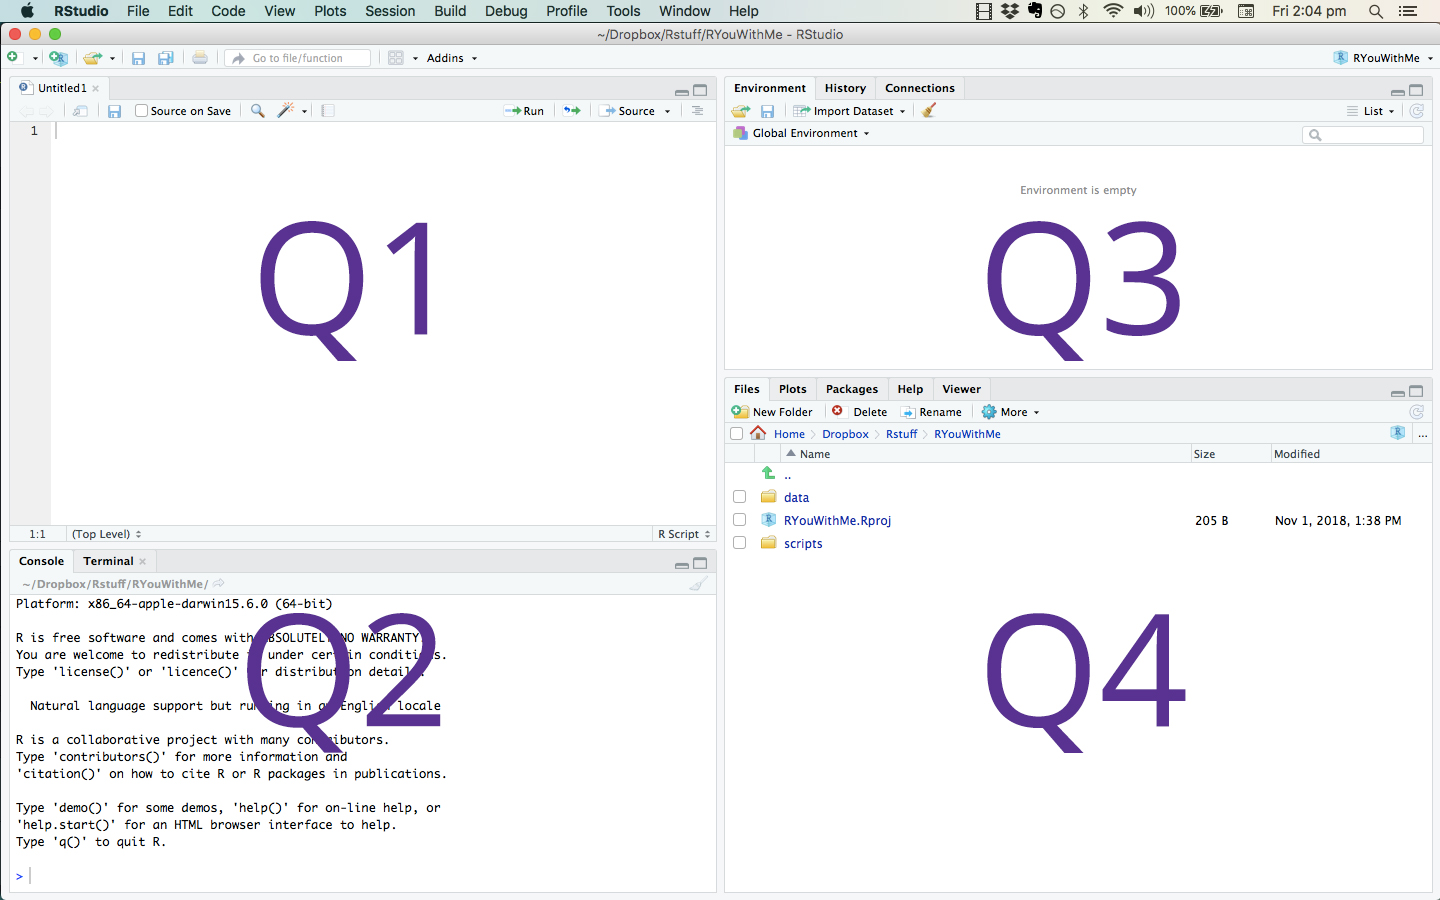
Described below are the features in the four quadrants.
- Q1. The Script Editor window (upper-left quadrant above) is a workspace where you can write, edit, and save R commands. Rather than entering these commands in the console window, you can run them from the script editor. The advantage is that you can easily edit, save and re-run all your analyses.
- Q2. The Console window (lower-left quadrant above) displays results. You can interact with R directly in the console window by typing commands. Use the script editor, though, since you can save your work for later use.
- Q3. The Environment Window (upper-right quadrant above) gives you a list of all the objects you have created, including datasets, graphs, and statistical model results.
- Q4. The Files window (lower-right quadrant above) provides a lot of information. The files tab gives you a file explorer. The plots tab provides a history of the graphs you have made. The packages tab shows you the packages you have available and the ones you have enabled. The help tab allows you to see help files for functions and packages. Occasionally, things you are trying to see will show up in the viewer tab.
Note: the size of each of these quadrants is adjustable by dragging the edges.
2.2 Customize How RStudio Looks
You can customize how R Studio looks to make it work for you. Click Tools - Global Options - Appearance. You can change the default font, font size, and general appearance of R Studio, including using dark mode. Play around with the settings and see what you prefer. You’re going to spend a lot of time with R, it might as well look nice!
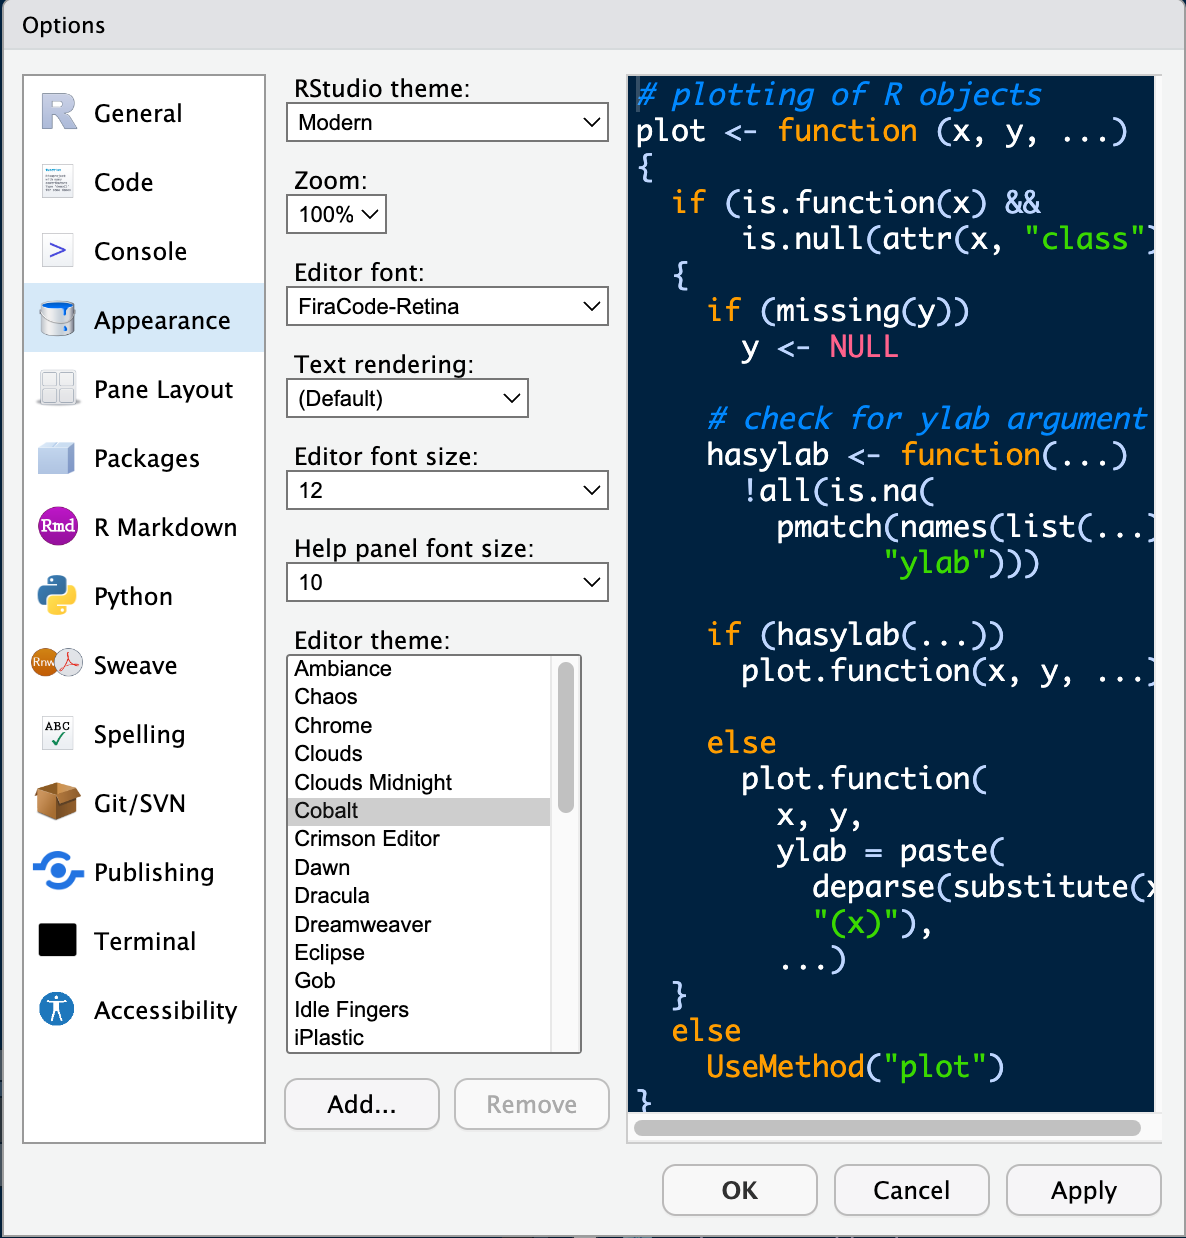
This is the layout I use on my computer.
There are a lot of options! But don’t let picking a theme get in the way of getting work done.
2.3 Move Graphs to the Viewer
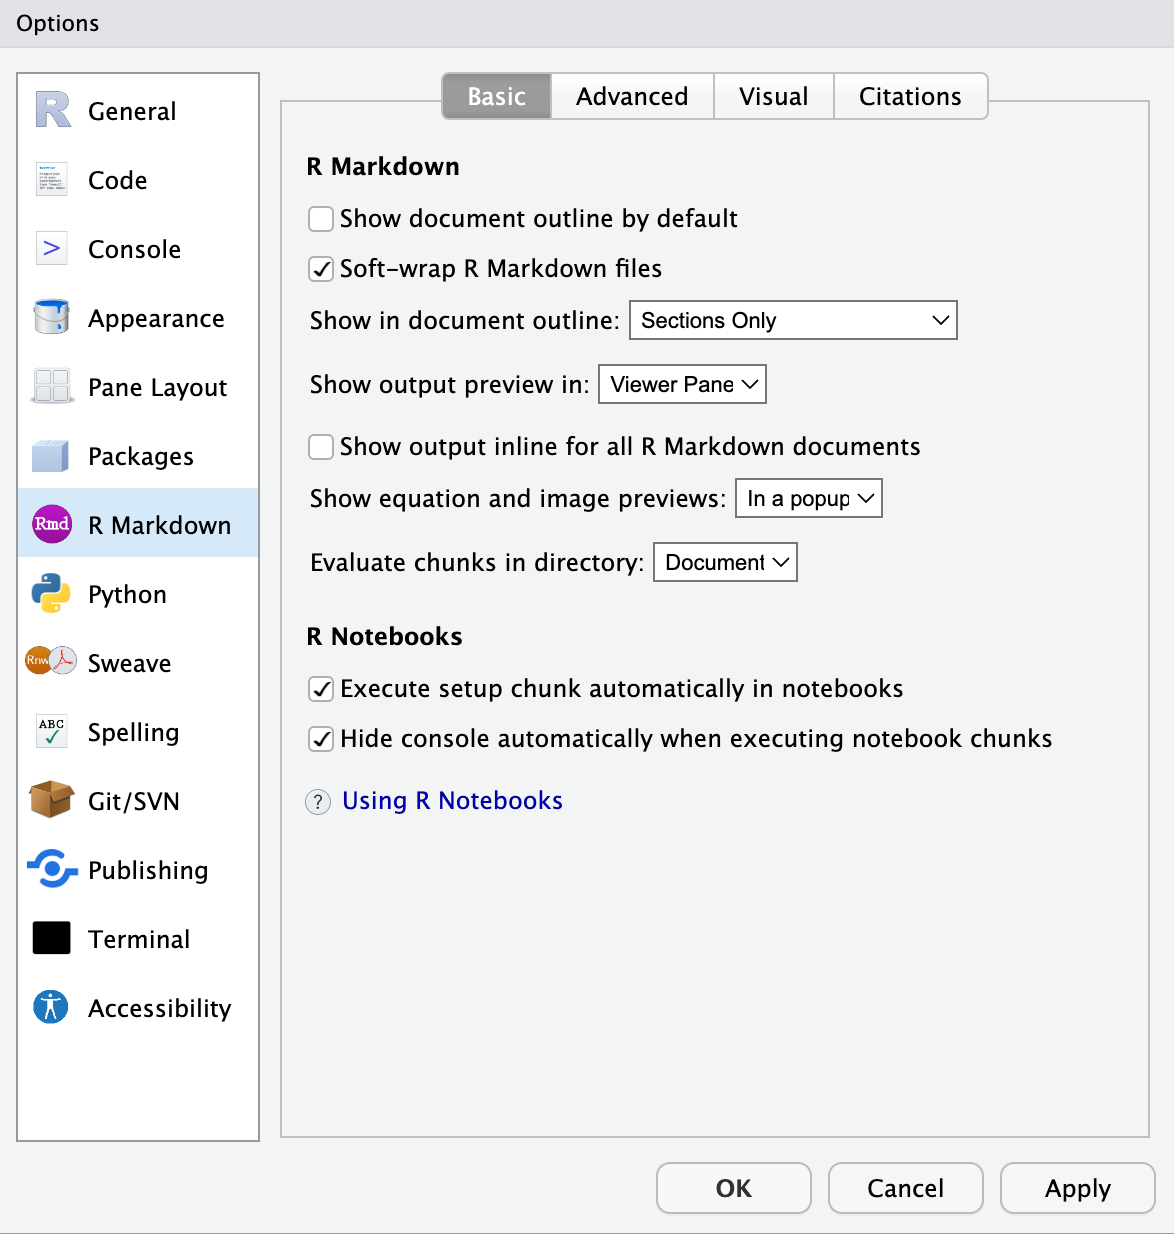
When you are writing your assignments it will be helpful to have the graphs show up in the viewer, not inline, below the code chunk. To set this up, go to Tools –> Global Options –> R Markdown. Then:
- Select “Viewer Pane” for “Show output preview in”.
- Make sure the box for “Show output inline for all R Markdown documents” is not selected.